Trip Volume is an indicator used by the Board to support data-driven decision-making. This indicator is primarily related to the demand factor, as described in the public need policy.
Trip Volume is calculated as the total number of completed trips reported to the Trip Database in each area over a specified month. When supply is steady, rising trip volume indicates increased demand for passenger transportation services, while declining volume suggests weaker demand.
For more information on this indicator, please see the Board’s indicators webpage.
Region 1 analysis
The following is an analysis of the Trip Volume indicator for passenger transportation Region 1 (Lower Mainland, Whistler).
Trip volume - Taxi sector
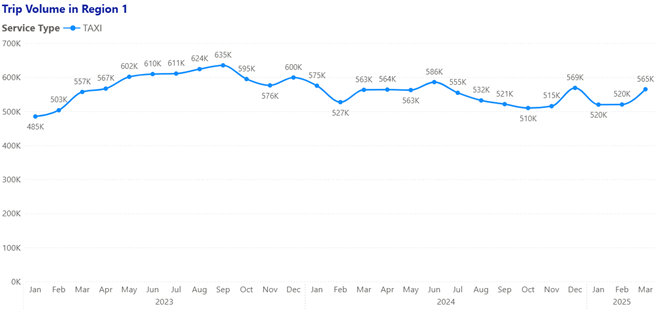
In Region 1, taxi trip volume in March 2025 was 565,000 trips. Compared to the same period last year in March 2024 (year-over-year), trip volume has increased by 0.36 per cent, or 2,000 trips.
On a year-to-date basis, total trip volume from January to March 2025 was 1,605,000 trips, representing a 3.60 per cent decrease from a total trip volume of 1,665,000 trips between January and March 2024.
Overall, this indicator shows no strong evidence of long-term growth or long-term decline in the demand for Region 1 taxi trips. The trend appears relatively stable over time, with only minor short-term fluctuations.
Trip volume - TNS sector
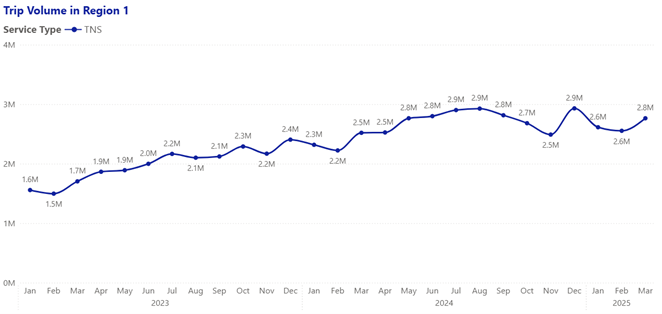
In Region 1, TNS trip volume in March 2025 was 2,800,000 trips. Compared to the same period last year in March 2024 (year-over-year), trip volume has increased by 12.00 per cent, or 300,000 trips.
On a year-to-date basis, total trip volume from January to March 2025 was 8,000,000 trips, representing a 12.50 per cent increase from a total trip volume of 7,000,000 trips between January and March 2024.
Overall, this indicator shows either more people are using TNS services or that, on average, the number of requested trips per user has been increasing, pointing to a strengthening in demand.[1]
Region 2 analysis
The following is an analysis of the Trip Volume indicator for passenger transportation Region 2 (CRD).
Trip volume - Taxi sector
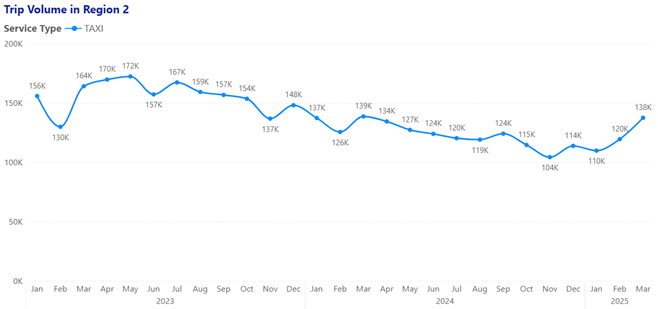
In Region 2, taxi trip volume in March 2025 was 138,000 trips. Compared to the same period last year in March 2024 (year-over-year), trip volume has decreased by 0.72 per cent, or 1,000 trips.
On a year-to-date basis, total trip volume from January to March 2025 was 368,000 trips, representing an 8.46 per cent decrease from a total trip volume of 402,000 trips between January and March 2024.
Overall, this indicator shows either fewer people are using taxi services or that, on average, the number of requested trips per user has been decreasing, pointing to a modest weakening in demand.
Trip volume - TNS sector
Trip Volume data in Region 2 does not meet data requirements and, therefore, was not reported.
[1] According to BC Stats, Metro Vancouver population grew 4.30 per cent from 2023 to 2024: https://www2.gov.bc.ca/assets/gov/data/statistics/people-population-community/population/pop_subprovincial_population_highlights.pdf