Wait time is an indicator used by the Board to support data-driven decision-making. This indicator is primarily related to the service quality factor, as described in the public need policy.
Wait time for each trip is calculated as the difference between the pick-up arrival time and the hail time. Wait time is measured by the median (i.e., the 50th percentile) of the monthly wait time distribution in an area.
Wait time serves as an indicator of the quality of passenger transportation services. It acts as a market-clearing indication, influenced by factors such as demand, supply, and the efficiency of the technology used to match passengers with vehicles. A longer median wait time indicates reduced service quality, as it suggests longer delays for passengers and higher operating costs for licensees.
For more information on this indicator, please see the Board’s Indicators webpage.
Region 1 analysis
The following is an analysis of the wait time indicator for Region 1 (Lower Mainland, Whistler).
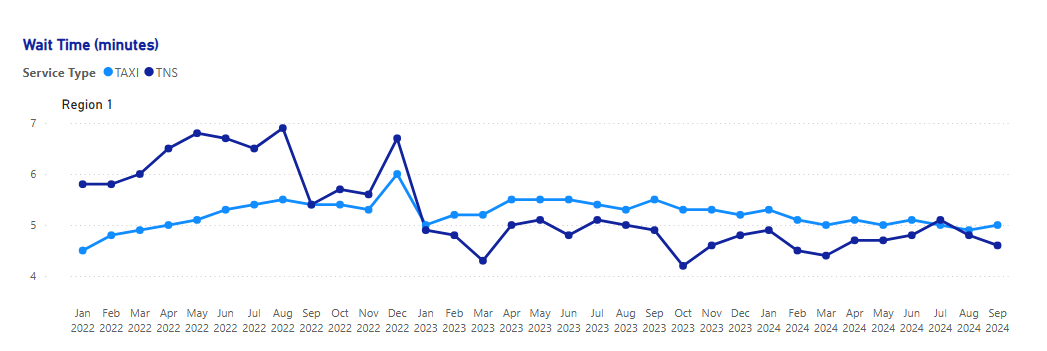
The median taxi wait time in Region 1 at the end of the reporting period is 5 minutes, 32 seconds shorter than the median wait time in the same region a year prior. Monthly median taxi wait time has been stable in the year leading up to the end of the reporting period, varying between 5 and 6 minutes.
The median TNS wait time in Region 1 at the end of the reporting period is 4.6 minutes, 18 seconds shorter than the median wait time in the same region a year prior. Monthly median TNS wait time has been stable in the year leading up to the end of the reporting period, varying between 4 and 5 minutes.
In general, consistent shortening of wait times indicates more efficient matching mechanisms or an increased supply of services, given stable demand.
Region 2 analysis
The following is an analysis of the wait time indicator for Region 2 (CRD).
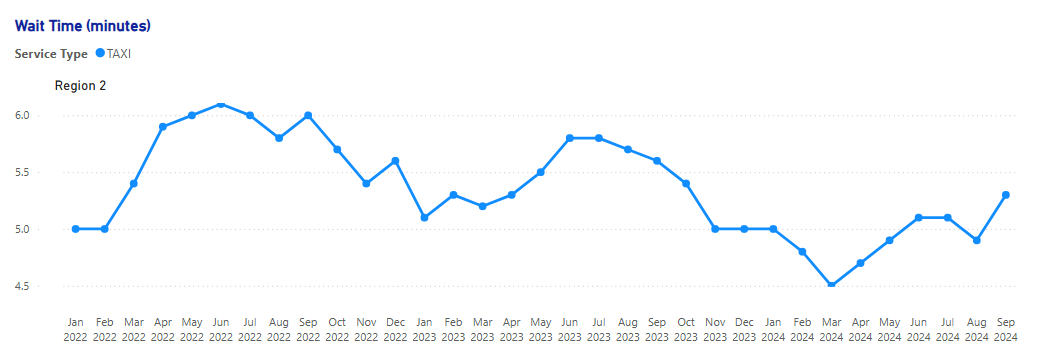
The median taxi wait time in Region 2 at the end of the reporting period is 5.3 minutes, 19 seconds shorter than a year ago. Monthly median taxi wait time has been stable in the year leading up to the end of the reporting period, varying between 5 and 6 minutes.
The Region 2 TNS wait time has not been provided as it does not meet the Board’s public data reporting guidelines.
In general, consistent shortening of wait times indicates more efficient matching mechanisms or an increased supply of services, given stable demand.