Newsletter introduction
The vehicle occupancy rate represents the proportion of working time during which a taxi or Transportation Network Services (TNS) vehicle carries passengers in an area over a month, reflecting the extent to which passengers are using the available services.
In the Lower Mainland (Region 1), the vehicle occupancy rate for the taxi sector has remained stable over the last two years, indicating steady utilization with no sustained upward or downward trend. Meanwhile, the vehicle occupancy rate for the TNS sector has shown a decreasing trend over the same period.
Similarly, in the Capital Regional District (Region 2), the vehicle occupancy rate for the taxi sector has remained stable over the last two years, while the vehicle occupancy rate for the TNS sector has decreased.
Vehicle occupancy rate indicator
The vehicle occupancy rate is an indicator used by the Board to support data-driven decision-making. This indicator is primarily related to the sustainability factor, as described in the Sound Economic Conditions Policy.
A high vehicle occupancy rate indicates frequent passenger occupancy, while a low vehicle occupancy rate suggests that vehicles are often empty. A low vehicle occupancy rate is unfavourable as it negatively impacts sustainable profitability. Additionally, significant changes in the vehicle occupancy rate can signal shifts in market stability and potential sustainability challenges.
For more information on this indicator, please see the Board’s indicators webpage.
Region 1 analysis
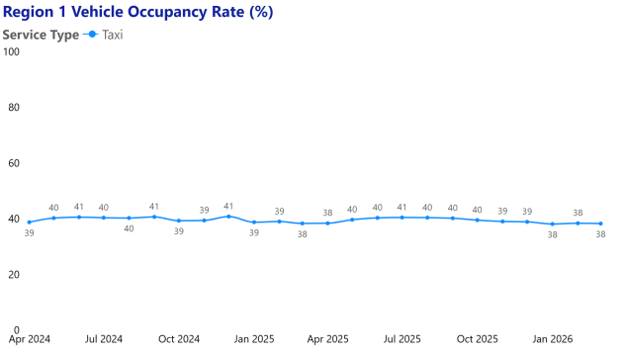
In Region 1, the taxi vehicle occupancy rate in March 2026 was 38 per cent, unchanged from February 2026. Statistical analysis of the short-term trend suggests that there is no recent shift in market conditions.
On a year-to-date basis, the taxi vehicle occupancy rate from January to March 2026 averaged 38 per cent, a 1.0 percentage point decrease from the 39 per cent average between January and March 2025. Statistical analysis of the long-term trend suggests that the vehicle occupancy rate has remained stable.
Overall, the taxi vehicle occupancy rate in this region has been stable over the last two years, with no detected recent shift in market conditions.
For context, major North American cities such as Boston, New York, San Francisco, Washington D.C., and Los Angeles have historically had passengers in taxi vehicles between 47 per cent and 53 per cent of working time. These comparisons should be interpreted with caution, as vehicle occupancy rates reflect the unique characteristics of the service in each city.[1] Moreover, different data sources can use different measures and metrics for working time. Therefore, comparisons to jurisdictions outside B.C. serve only as high-level background rather than performance benchmarks.
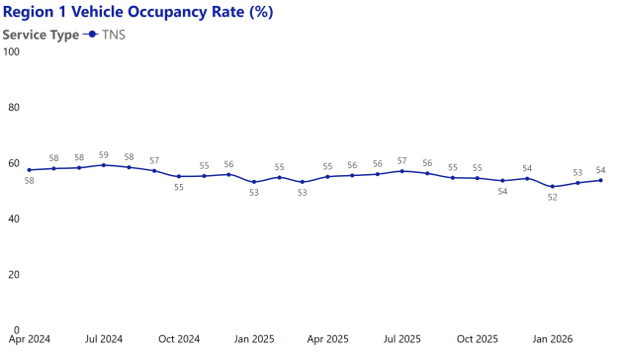
In Region 1, the TNS vehicle occupancy rate in March 2026 was 54 per cent, up 1.0 percentage point from February 2026. Statistical analysis of the short-term trend suggests that there is no recent shift in market conditions.
On a year-to-date basis, the TNS vehicle occupancy rate from January to March 2026 averaged 53 per cent, a 1.0 percentage point decrease from the 54 per cent average between January and March 2025. Statistical analysis of the long-term trend suggests that the vehicle occupancy rate has shown a downward trend.
Overall, the TNS vehicle occupancy rate in this region has decreased over the last two years, with no recent deviation from the ongoing downward trend.
For context, major North American cities such as Boston, New York, San Francisco, Washington D.C., and Los Angeles have historically had passengers in ride-hailing vehicles between 44 per cent and 68 per cent of working time. These comparisons should be interpreted with caution, as vehicle occupancy rates reflect the unique characteristics of the service in each city. Moreover, different data sources can use different measures and metrics for working time. Therefore, comparisons to jurisdictions outside B.C. serve only as high-level background rather than performance benchmarks.
Region 2 analysis
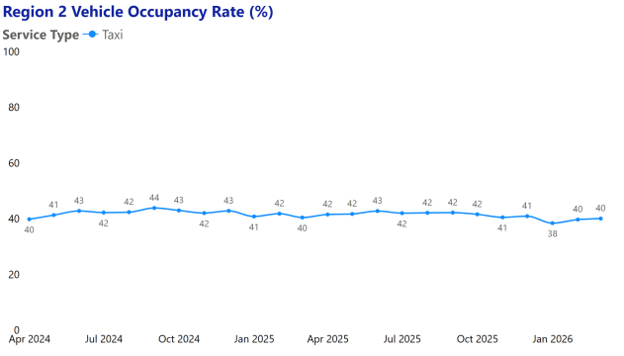
In Region 2, the taxi vehicle occupancy rate in March 2026 was 40 per cent, unchanged from February 2026. Statistical analysis of the short-term trend suggests that there is no recent shift in market conditions.
On a year-to-date basis, the taxi vehicle occupancy rate from January to March 2026 averaged 40 per cent, down 1.0 percentage point from the average of the same period last year. Statistical analysis of the long-term trend suggests that the vehicle occupancy rate has remained stable.
Overall, the taxi vehicle occupancy rate remains stable in Region 2 with no detected recent shift in market conditions.
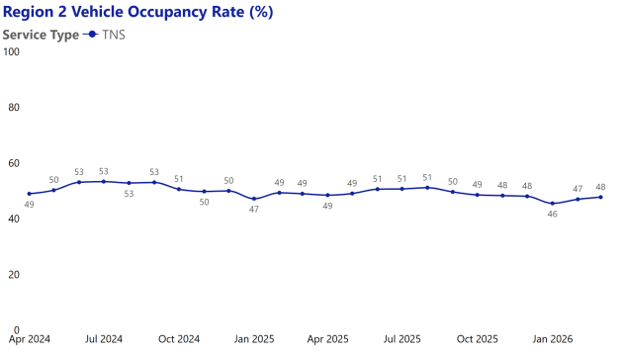
In Region 2, the TNS vehicle occupancy rate in March 2026 was 48 per cent, up 1.0 percentage point from February 2026. Statistical analysis of the short-term trend suggests that there is no recent shift in market conditions.
On a year-to-date basis, the TNS vehicle occupancy rate from January to March 2026 averaged 47 per cent, a 1.0 percentage point decrease from the 48 per cent average between January and March 2025. Statistical analysis of the long-term trend suggests that the vehicle occupancy rate has shown a downward trend.
Overall, the TNS vehicle occupancy rate in this region has decreased over the last two years, with no detected deviation from the ongoing downward trend.
[1] Cramer, J., & Krueger, A. B. (2016). Disruptive change in the taxi business: The case of Uber. American Economic Review, 106(5), 177–182. https://doi.org/10.1257/aer.p20161002