Availability is an indicator used by the Board to support data-driven decision-making. This indicator is primarily related to the Accessibility factor, as described in the public need policy.
This indicator measures the availability of passenger transportation services using three metrics:
- Active vehicles per 1,000 population: This metric shows how many vehicles are available to serve every 1,000 people in an area.
- Matching time by hour of the week: This metric shows how long passengers usually wait to be picked up during different hours of a typical week[1].
- Hourly vehicle availability patterns: This metric shows how the number of active vehicles changes by hour across the typical week, relative to trip volume.
The availability indicator provides a view of how easily passengers can access passenger transportation services. Each metric offers distinct insights:
- Active vehicles per 1,000 population: measures general accessibility. A higher number means more service is available in the region, and a lower number means less service is available in the region.
- Matching time by hour of the week: provides a direct measure of service responsiveness. Shorter matching time at a given hour indicates the short-term demand is being met with sufficient supply of vehicles, and longer matching time indicates short-term demand is not being met with sufficient vehicle supply.
- Hourly vehicle availability patterns: illustrate the variation of service capacity relative to the number of passenger trips during different periods in a week. When the number of active vehicles goes down while trip volume is going up, service availability is reduced. When the number of active vehicles goes up while trip volume is going down, availability is improved, but possibly at the cost of operational efficiency.
For more information on this indicator, please see the Board’s indicators webpage.
Region 1
The following is an analysis of the availability indicator for passenger transportation Region 1 (Lower Mainland, Whistler).
Availability - Taxi sector
Taxi: Active vehicles per 1,000 population
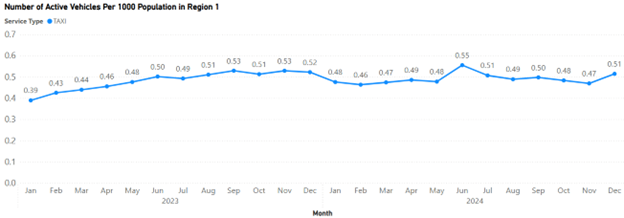
Figure 1 shows the monthly number of active taxi vehicles per 1,000 population in Region 1 throughout 2023 and 2024. This metric indicates how many vehicles, on average, were available to serve 1,000 people each month. In 2024, the number of active taxi vehicles per 1,000 population ranged from a low of 0.46 in February to a high of 0.56 in June.
This metric shows moderate fluctuations throughout 2024, with a peak in June and a generally stable pattern from July to December. In December 2024, the number of active vehicles per 1,000 people was 0.51, which was 0.01, or 1.5%, lower than a year ago in December 2023. This shows stability in the number of active vehicles year-over-year.
For context, Montreal and Toronto have 2.5 and 2.4 taxi vehicles per 1,000 people, respectively. These comparisons should be interpreted with caution, as each location has unique features such as population density, transit options, terrain, as well as a range of other factors that would influence demand and supply. Region 1 contains urban, suburban, and low-density areas, and the reference to jurisdictions outside B.C. serves only as general background.
Taxi: Matching time by hour of the week
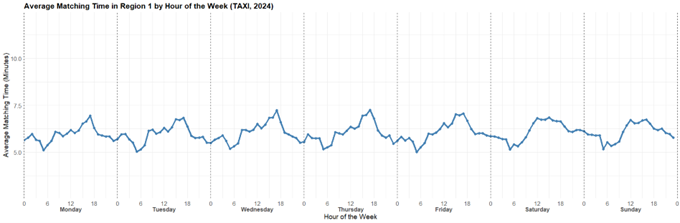
Figure 2 shows the average matching time for taxis in Region 1 in each hour of the week in 2024. This metric is based on dispatched trips, excluding street-hails. In Region 1, average taxi matching times varied within a narrow range between 5.0 and 7.5 minutes. The pattern was consistent throughout the week, indicating general stability in service availability in the taxi sector. Matching times are usually the shortest, between 3 and 6 a.m., and are usually longest between 3 and 6 p.m. on weekdays, and between noon and 4 p.m. during the weekend.
Overall, the matching time for taxis remained stable throughout the week with no significant variation, which indicates that taxi passengers in Region 1 generally experienced reliably available service with relatively short average matching times across all days and hours.
Taxi: Hourly vehicle availability patterns
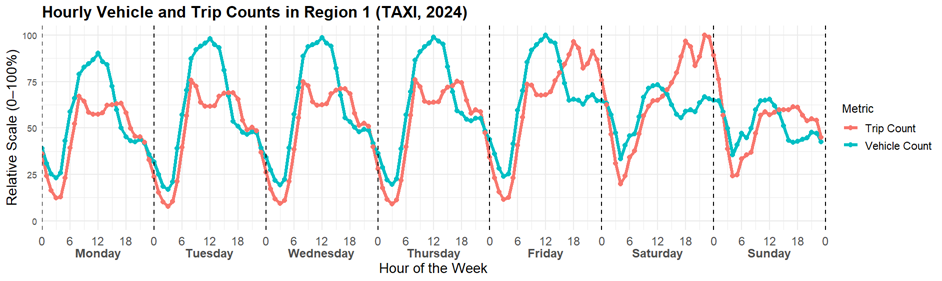
Figure 3 shows the patterns of average hourly trip count (in green) and average hourly vehicle count (in orange) for taxis in Region 1 across each hour of a week. Both lines were scaled to facilitate visualization.
Trip counts follow a consistent daily pattern, peaking between 6 and 10 a.m. and between 3 and 8 p.m. on weekdays, and peaking between 6 p.m. and midnight on Fridays and Saturdays. In contrast, the number of active taxi vehicles remains relatively steady throughout the week, with only small increases during daytime hours and slightly lower levels overnight.
The relatively stable pattern of active vehicle counts suggests that the taxi sector may be less responsive to short-term fluctuations in trip volume. During weekday afternoon peak hours, vehicle supply tends to remain stable or decline slightly, even as trip demand rises. This can lead to reduced vehicle availability and a moderate increase in matching times, as reflected in the “matching time by hour of the week” metric. In addition, the data suggest that vehicle availability may not fully align with weekend evening demand peaks. These observations point to potential opportunities for improved alignment between vehicle supply and peak-period demand, which could enhance service availability for passengers.
Data analysis shows that a minimum number of active vehicles are present at all hours, including overnight. This indicates that taxi services offer continuous 24/7 available service, contributing to baseline service coverage and helping to meet the Board’s accessibility factor objective of ensuring round-the-clock access to passenger transportation.
Availability - TNS sector
TNS: Active vehicles per 1,000 population
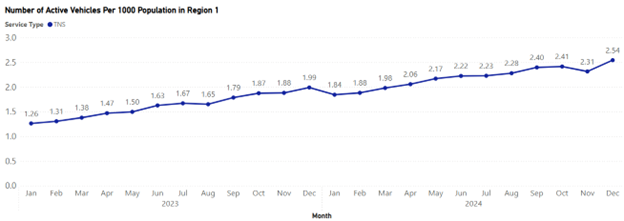
Figure 4 shows the monthly number of active TNS vehicles per 1,000 population in Region 1 for 2023 and 2024. This metric indicates how many vehicles on average were available to serve 1,000 people each month[2]. In 2024, the number of active TNS vehicles per 1,000 population grew from a low of 1.84 in January to a high of 2.54 in December. This year-end number in 2024 represents a 0.55, or 27.6% increase from 1.99 in December 2023. The growth trend reflects a steady and continuous expansion of TNS service in the region.
For context, Montreal has 5.00 active TNS vehicles per 1,000 people, while Toronto has 17.00 for 1,000 people. These comparisons should be interpreted with caution, as each location has unique features such as population density, transit options, terrain, as well as a range of other factors that would influence demand and supply. The region considered here contains urban, suburban, and low-density areas, and the reference to jurisdictions outside B.C. serves only as a general background.
TNS: Matching time by hour of the week
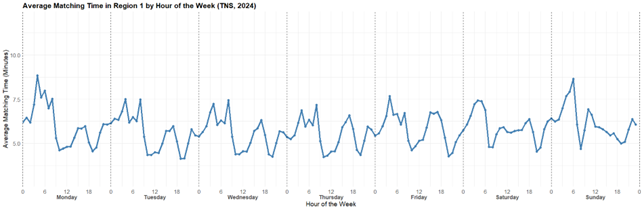
Figure 5 shows the average matching time for TNS in Region 1 in each hour of the week in 2024. Matching times ranged from 4.5 to 8.8 minutes with higher peaks observed during early mornings. While TNS generally covers a broad geographic area, it is subject to demand surges periodically and as a result, matching time increases.
Overall, average matching times for TNS exhibit pronounced peaks and valleys in a typical week but remained under 9.0 minutes throughout the week.
TNS: Hourly vehicle availability patterns
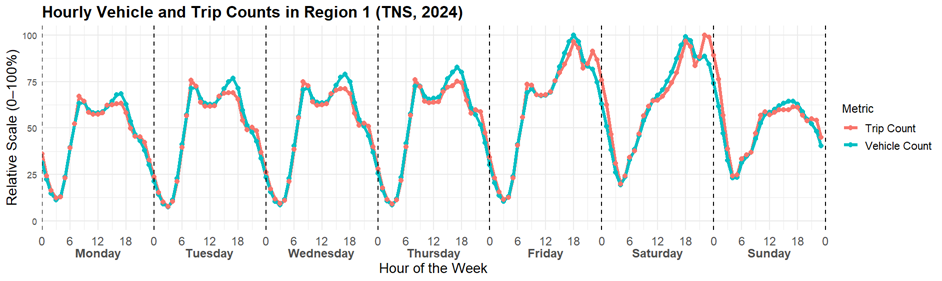
Figure 6 shows the patterns of average hourly trip count (in green) and average hourly vehicle count (in orange) for TNS in Region 1 across each hour of a typical week. Both lines were scaled to facilitate visualization.
The TNS sector displays a strong alignment between hourly trip count and hourly active vehicles. As trip volumes rise during weekday peak hours and weekend evenings, the number of active TNS vehicles increase accordingly. This flexible pattern of service availability suggests that the TNS sector is responsive to hourly trip count patterns, with active vehicles increasing their activities during rush hours and reducing supply during off-peak hours.
Data analysis shows that a minimum number of active vehicles are present at all hours, including overnight. This indicates that TNS services offer continuous 24/7 available service, contributing to baseline service coverage and helping to meet the Board’s accessibility factor objective of ensuring round-the-clock access to passenger transportation.
Region 2 analysis
The following is an analysis of the indicator for passenger transportation Region 2 (CRD).
Availability - Taxi sector
Taxi: Active vehicles per 1,000 population
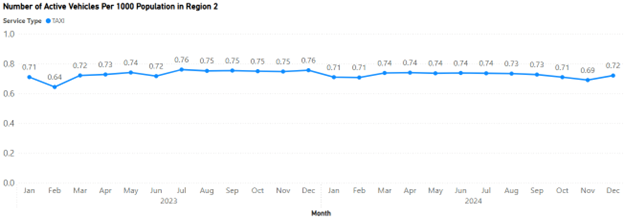
Figure 1 shows the monthly number of active taxi vehicles per 1,000 population in Region 2 throughout 2023 and 2024. This metric indicates how many vehicles, on average, were available to serve 1,000 people each month. In 2024, the number of active taxi vehicles per 1,000 population ranged within a small range from a low of 0.69 in November to a high of 0.74 from March to July.
This metric shows stability throughout 2024, without peaks and valleys. In December 2024, the number of active vehicles per 1,000 people was 0.72, which was 0.04, or 5.3%, lower than a year ago in December 2023. The annual averages in 2023 and 2024 were 0.73 and 0.72, respectively. This shows stability in the number of active vehicles year-over-year.
For context, Montreal and Toronto have 2.5 and 2.4 taxi vehicles per 1,000 people, respectively. These comparisons should be interpreted with caution, as each location has unique features such as population density, transit options, terrain, as well as a range of other factors that would influence demand and supply. Region 2 contains urban, suburban, and low-density areas, and the reference to jurisdictions outside B.C. serves only as general background.
Taxi: Matching time by hour of the week
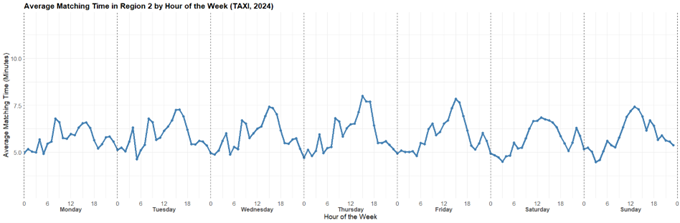
Figure 2 shows the average matching time for taxis in Region 2 in each hour of the week in 2024. This metric is based on dispatched trips, excluding street-hails. In Region 2, average taxi matching times varied within a narrow range between 4.5 and 8.0 minutes. The pattern was consistent throughout the week, indicating general stability in service availability in the taxi sector. Matching times are usually the shortest, between 12 and 6 a.m. Matching times are usually the longest between 3 and 6 p.m. on weekdays, and between noon and 3 p.m. during the weekend.
Overall, the matching time for taxis remained stable throughout the week with no significant variation, which indicates that taxi passengers in Region 2 generally experienced reliably available service with relatively short average matching times across all days and hours.
Taxi: Hourly vehicle availability patterns
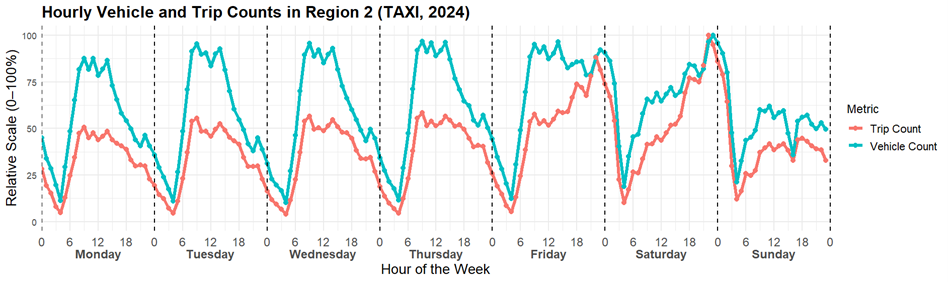
Figure 3 shows the patterns of average hourly trip count (in green) and average hourly vehicle count (in orange) for taxis in Region 2 across each hour of a week. Both lines were scaled to facilitate visualization.
Trip counts follow a consistent daily pattern, peaking around 9 a.m. and again between 2 and 8 p.m. from Sunday to Thursday, and peaking between 9 and 10 p.m. on Fridays and Saturdays. In general, the number of active vehicles tracks closely with trip volume, except on Friday afternoon, when vehicle availability decreases while trip volume increases.
The taxi sector in Region 2 displays a pattern of alignment between hourly trip count and hourly active vehicles. As trip volumes rise during weekday peak hours and weekend evenings, the number of active taxi vehicles increases accordingly. This responsive pattern of service availability suggests that the taxi sector is responsive to hourly trip count patterns, with active vehicles increasing their activities during rush hours and reducing supply during off-peak hours.
Data analysis shows that a minimum number of active vehicles are present at all hours, including overnight. This indicates that taxi services offer continuous 24/7 available service, contributing to baseline service coverage and helping to meet the Board’s accessibility factor objective of ensuring round-the-clock access to passenger transportation.
Availability - TNS sector
The Region 2 TNS availability indicator has not been provided as it does not meet the Board’s public data reporting guidelines.
[1]The typical week is constructed by averaging each hour of the day across all occurrences of that weekday throughout the year. For example, the Monday profile reflects the average matching time at each hour, calculated using all Mondays in the year.
[2] The number of active TNS vehicles per 1,000 population is not directly comparable to active taxi vehicles because, on average, TNS operators are on the road fewer hours than taxi operators per week.