Driver hourly revenue indicator
Driver Hourly Revenue is an indicator used by the Board to support data-driven decision-making. This indicator is primarily related to the Sustainability factor, as described in the sound economic conditions policy.
This indicator captures the median[1] of the total fare[2] collected by taxi and TNS drivers per working hour in a defined geographical area for over a month. It reflects whether the passenger transportation sector is producing a sustainable level of revenue for drivers to promote retention of their workforce.
Higher hourly revenue indicates stronger revenue generation for the sector, supporting its long-term operational sustainability. This indicator measures median hourly revenue at the sector level and does not reflect individual driver take-home earnings, which can vary based on a variety of factors. The focus is on the sector’s overall financial health and its ability to maintain service levels over time. For more information on this indicator, please see the Board’s indicators webpage.
Region 1 analysis
The following is an analysis of the Driver Hourly Revenue indicator for passenger transportation Region 1 (Lower Mainland, Whistler).
Driver hourly revenue - Taxi sector
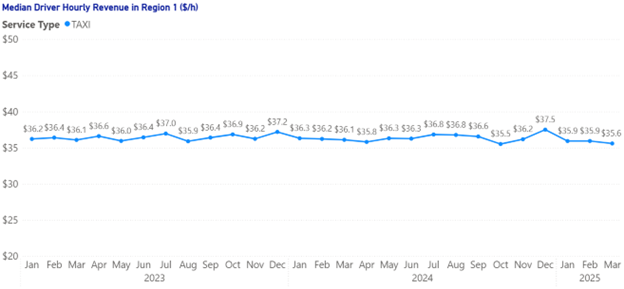
Figure 1 shows the median revenue received per active working hour[3] by taxi drivers in Region 1 from January 2023 to March 2025. This metric reflects the gross fare collected per hour of active working time.
Throughout this period, taxi drivers’ hourly revenue remained stable, fluctuating narrowly between $35.5 and $37.4 per hour. The values indicate consistency and a strong floor in the sector’s revenue performance, with small monthly variations. The highest observed monthly value was $37.4 per hour in December 2024. This consistency implies that the taxi sector has maintained steady revenue per working hour, with no significant year-over-year change.
The absence of peaks or valleys suggests that the taxi sector is resilient and largely unaffected by short-term shocks or surges in demand. This consistency supports the sustainability of the sector, as the sector continues to provide a sustainable level of operation and service, and retain its workforce.
Driver hourly revenue - TNS sector
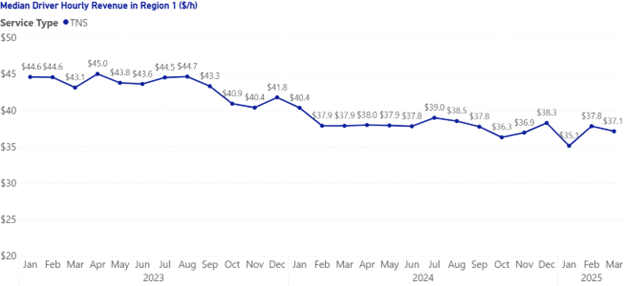
Figure 2 shows the median revenue per active hour for TNS drivers in Region 1 from January 2023 to March 2025. TNS drivers typically earned higher hourly revenue during 2023 than in 2024 and the first quarter of 2025, with values peaking at $45.0 per hour. A downward trend emerged between September 2023 and February 2024, which stabilized to fluctuate between $35.1 per hour and $39.0 per hour between March 2024 and March 2025.
Region 2 analysis
The following is an analysis of the indicator for passenger transportation Region 2 (CRD).
Driver hourly revenue - Taxi sector
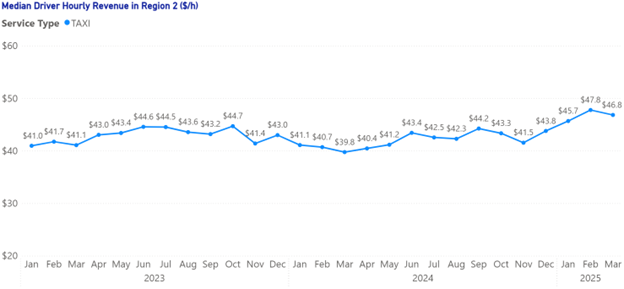
Figure 3 shows the median revenue earned per active working hour by taxi drivers in Region 2 from January 2023 to March 2025. This metric captures the gross fare collected per hour of active working time.
Taxi hourly revenue in Region 2 ranged from $39.8 to $47.8 per hour across the period. The highest monthly revenue ($47.8 per hour) was observed in February 2025. A modest decline occurred in December 2023, reaching a low of $39.8 per working hour in March 2024. However, a recovery followed, and revenue reached $46.8 per hour by March 2025.
Overall, this pattern suggests stability in the taxi sector, with relatively minor fluctuations in hourly driver revenues. The revenue per working hour remained within a narrow band, which is crucial for the sector to continue providing a sustainable level of operation, providing service and retaining its workforce.
Driver hourly revenue - TNS sector
The Region 2 TNS Driver Hourly Revenue has not yet met the data requirements and has not been reported.
[1] The median of a range of values represents the midpoint so that half of the values are greater than the median and the rest are smaller than the median.
[2] Total fare is the sum of the amount passengers pay.
[3] Active working hours represent an estimate of true working time, aggregated from one or more active spans—a series of trips separated by gaps of 60 minutes or less. See the Board’s indicators webpage for a detailed explanation.