Fare Cost is an indicator used by the Board to support data-driven decision-making. This indicator is primarily related to the affordability factor, as described in the public need policy.
This indicator measures the passenger fare cost of taxi services, using two related metrics:
- Fare for a 5 km trip: This metric captures the typical fare for a five-kilometre trip measured in dollar amounts.
- Real cost for a 5 km trip: This metric captures the fare cost of a five-kilometre trip, measured in labour compensation of a typical B.C. worker[1].
Fare Cost serves as an indicator of the affordability of passenger transportation services.
- The first metric (fare for a 5 km trip) measures the typical cost of passenger trips that are determined by the rate structure, trip patterns, and traffic conditions, but it only indirectly reflects affordability for passengers.
- A higher fare for a 5 km trip means passengers typically pay more for their trips, and it may indicate less affordable services if general wage levels in the area did not increase at a higher rate than this metric. On the other hand, a lower fare for a 5 km trip means passengers typically pay less for their trips, and it may indicate improved affordability if general wage levels in the area did not decrease at a higher rate than this metric.
- The second metric (real cost for a 5 km trip) is a more direct measure of affordability because it measures the trip cost in relation to a typical B.C. worker’s working time.
- A higher real cost indicates reduced affordability. On the other hand, a lower real cost indicates passenger trips are more affordable.
For more information on this indicator, please see the Board’s indicators webpage.
Region 1 analysis
The following is an analysis of the Fare Cost indicator for passenger transportation Region 1 (Lower Mainland, Whistler).
Fare cost - Taxi sector
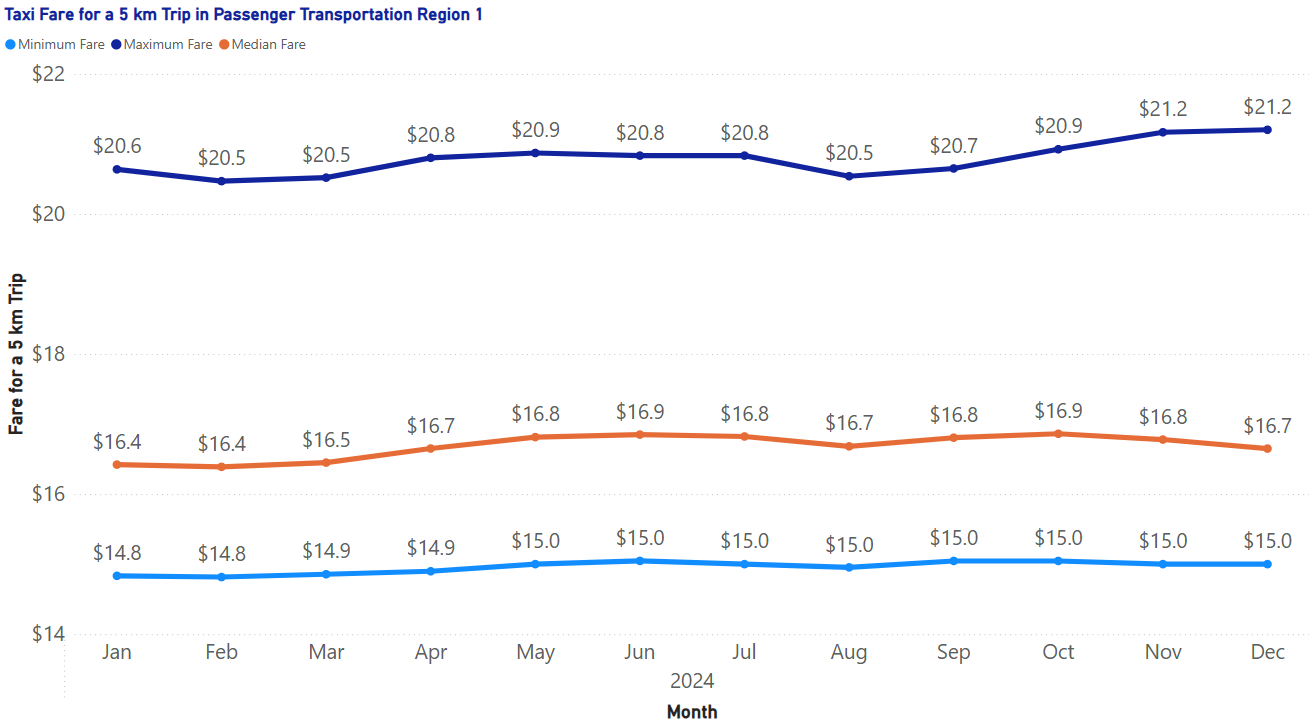
Figure 1 shows the minimum and maximum[2], as well as median[3], fare for a 5 km taxi trip. This shows the range of fares paid by passengers for a 5 km taxi trip in Region 1. The minimum fare for a 5 km taxi trip ranges from $14.80-$15.00. The maximum fare for a 5 km taxi trip ranges from $20.50-$21.20. The median fare ranges from $16.40-$16.90.
In Region 1, the median fare for a 5 km taxi trip remained stable throughout 2024. This shows stability in the affordability factor for taxi passengers. Looking at longer term trends, in December 2024, the median taxi fare for a 5 km trip was $16.7, which was 8 cents, or 1.1%, higher than a year ago in December 2023. This shows relative stability year-over-year.
Taxi: Real cost for a 5 km trip
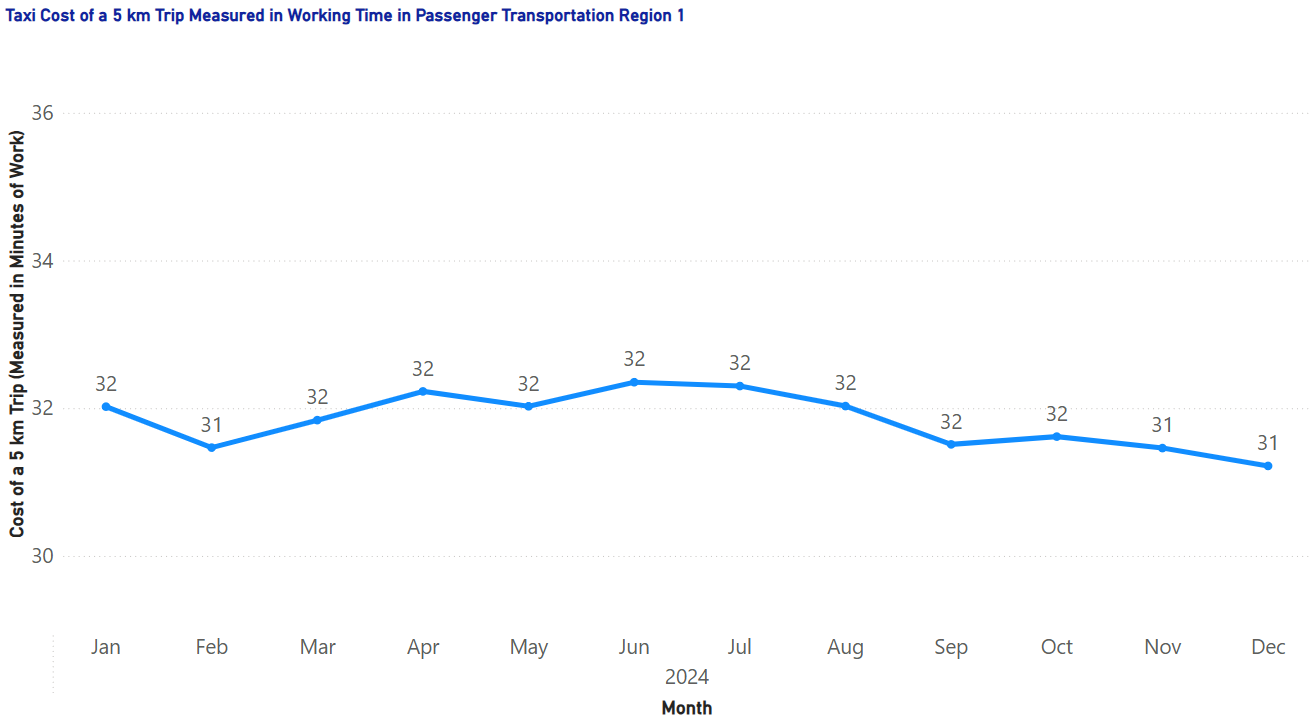
Figure 2 shows the real cost for a 5 km taxi trip measured in labour earnings of a typical B.C. worker. This metric is calculated by looking at the median hourly wage in B.C., based on Statistics Canada, and determining how many minutes this typical B.C. worker would need to work to pay for the median 5 km taxi fare. Over 2024, this amounted to between 31-32 minutes of work.
This metric remained stable in 2024, indicating the affordability factor, as measured by fare cost relative to passenger income, has remained consistent. In December 2024, a passenger who earned the B.C. median wage could pay for the taxi trip using earnings from 31 minutes of work, which was a 2.2 minute, or 3.7%, decrease from a year ago in December 2023. This shows that the real cost for a 5 km taxi trip has been stable year-over-year and has been slightly improving from 2023 to 2024. In other words, any increase in taxi trip fares has been offset by increases in median wage.
During the period from January 2022 to December 2024, there were two Board-approved rate changes for the taxi sector in Region 1. These rate increases were to offset rising inflation over the period. However, the taxi rate changes did not outpace the growth in hourly wage rate in B.C. and, therefore, the affordability factor has remained stable.
Fare cost - TNS sector
TNS: Fare for a 5 km trip
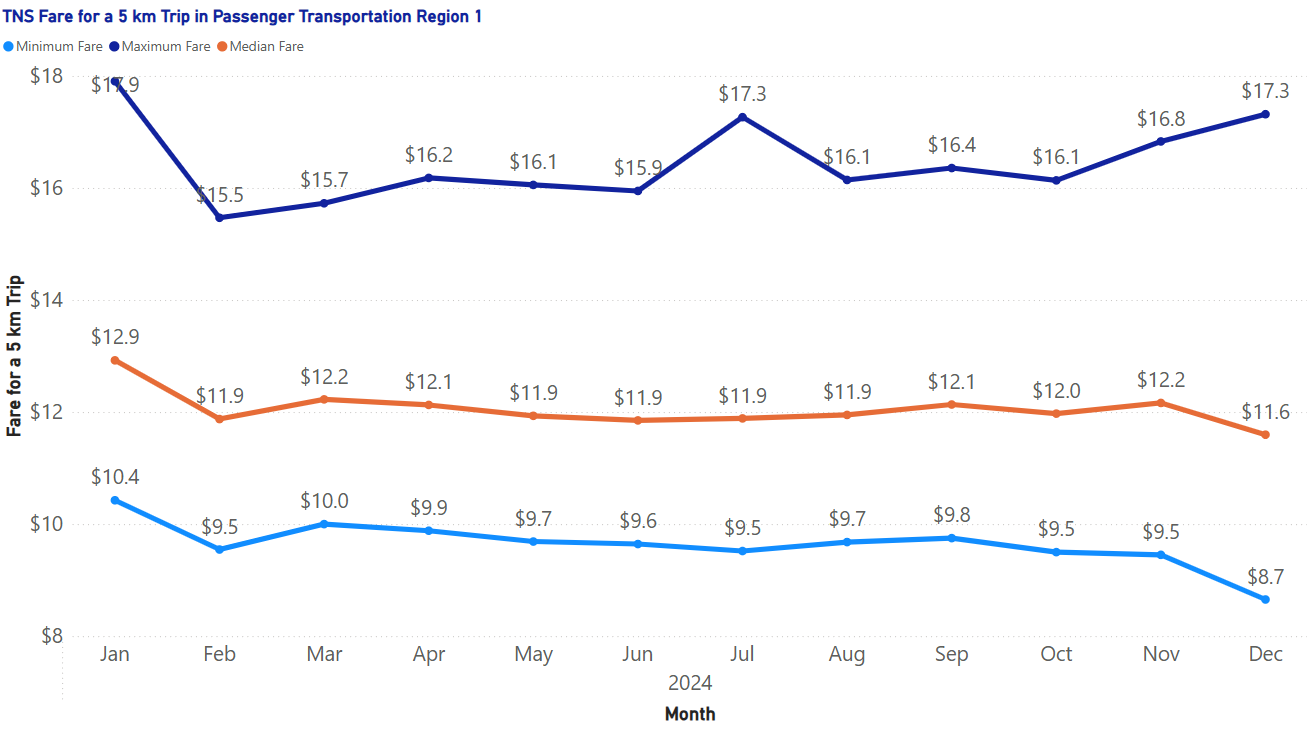
Figure 3 shows minimum and maximum, as well as median, fare for a 5 km TNS trip. This shows the range of fares paid by passengers for a 5 km TNS trip in Region 1. The minimum fare for a 5 km TNS trip ranges from $8.70-$10.40. The maximum fare for a 5 km TNS trip ranges from $15.50-$17.90. The median fare ranges from $11.60-$12.90.
In Region 1, the median fare for a 5 km TNS trip has trended down in 2024. This shows improvement in the affordability factor for TNS passengers. Looking at longer term trends, in December 2024, the median TNS fare for a 5 km trip was $11.6, which was $1.9, or 14.1%, lower than a year ago in December 2023. This shows relative improvement in affordability year-over-year.
TNS: Real cost for a 5 km trip
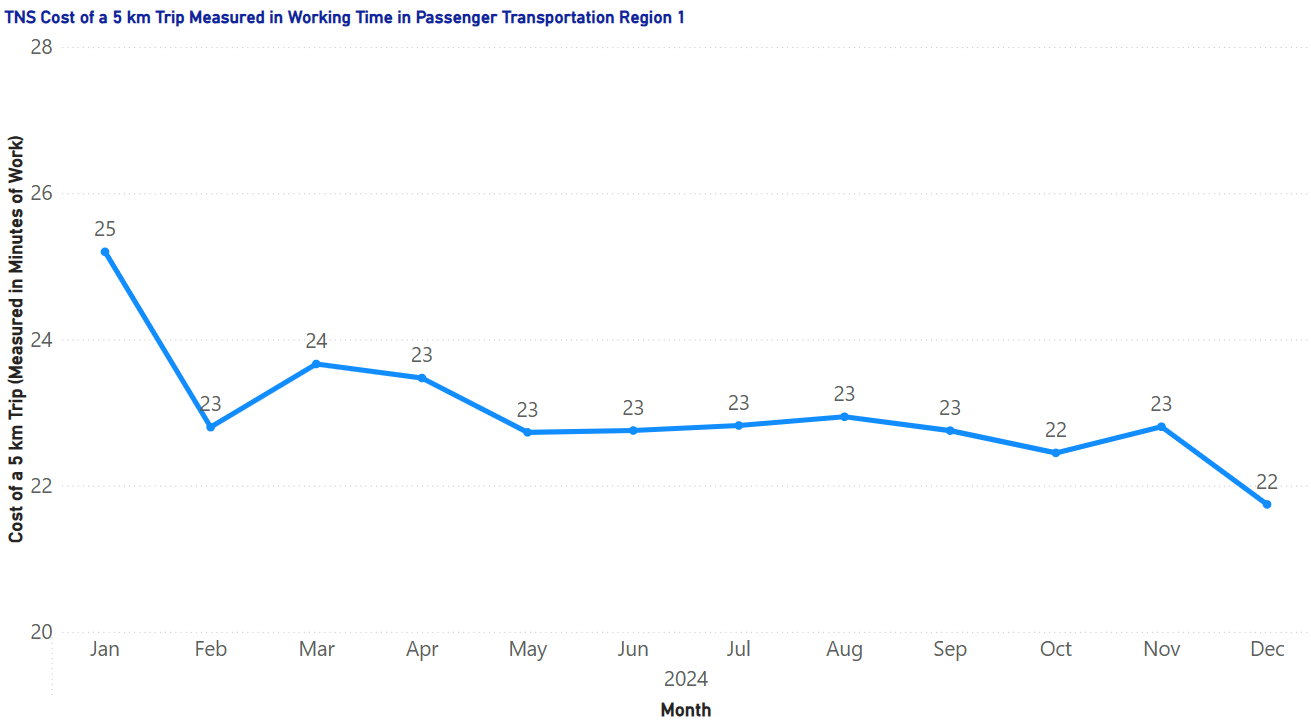
Figure 4 shows the real cost for a 5 km TNS trip measured in labour earnings of a typical B.C. worker. This metric is calculated by looking at the median hourly wage in B.C., based on Statistics Canada, and determining how many minutes this typical B.C. worker would need to work to pay for the median 5 km TNS fare. Over 2024, this amounted to between 22-25 minutes of work.
This metric trended down in 2024, indicating the affordability factor, as measured by fare cost relative to passenger income, has improved for TNS. In December 2024, a passenger who earned the B.C. median wage could pay for the TNS trip using earnings from 22 minutes of work, which was a 4 minute, or 18.2%, decrease from a year ago in December 2023. This shows that the real cost for a 5 km TNS trip has improved year-over-year, as increases in B.C. median wage have more than offset the TNS fare fluctuations.
Region 2 analysis
The following is an analysis of the indicator for passenger transportation Region 2 (CRD).
Fare cost - Taxi sector
Taxi: Fare for a 5 km trip[4]
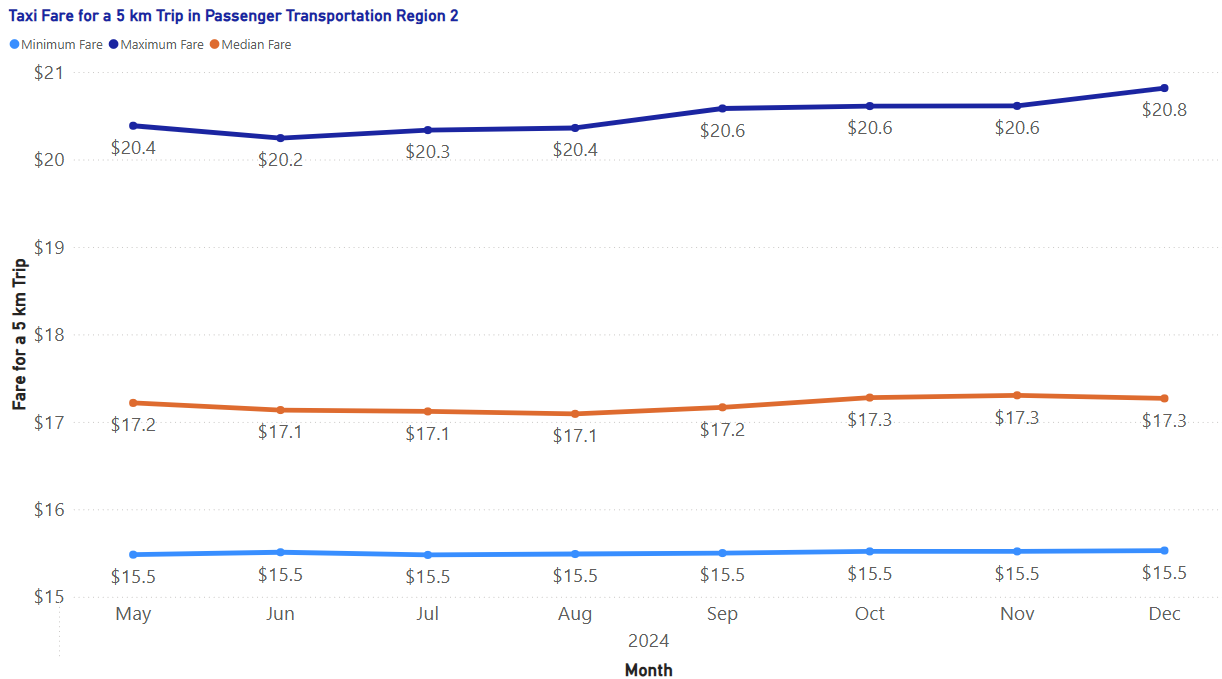
Figure 5 shows the minimum and maximum, as well as median, fare for a 5 km taxi trip. This shows the range of fares paid by passengers for a 5 km taxi trip in Region 2. The minimum fare for a 5 km taxi trip remains stable at $15.50. The maximum fare for a 5 km taxi trip ranges from $20.20-$20.80. The median fare ranges from $17.10-$17.30.
In Region 2, the median fare for a 5 km taxi trip remained stable since May 2024. This shows stability in the affordability factor for taxi passengers. In December 2024, the median taxi fare for a 5 km trip was $17.3, which was $0.1, or 0.6%, higher than May 2024.
Since the data needed to calculate this metric was unavailable before May 2024, we cannot yet draw data-supported conclusions on longer term affordability trends.
Taxi: Real cost for a 5 km trip
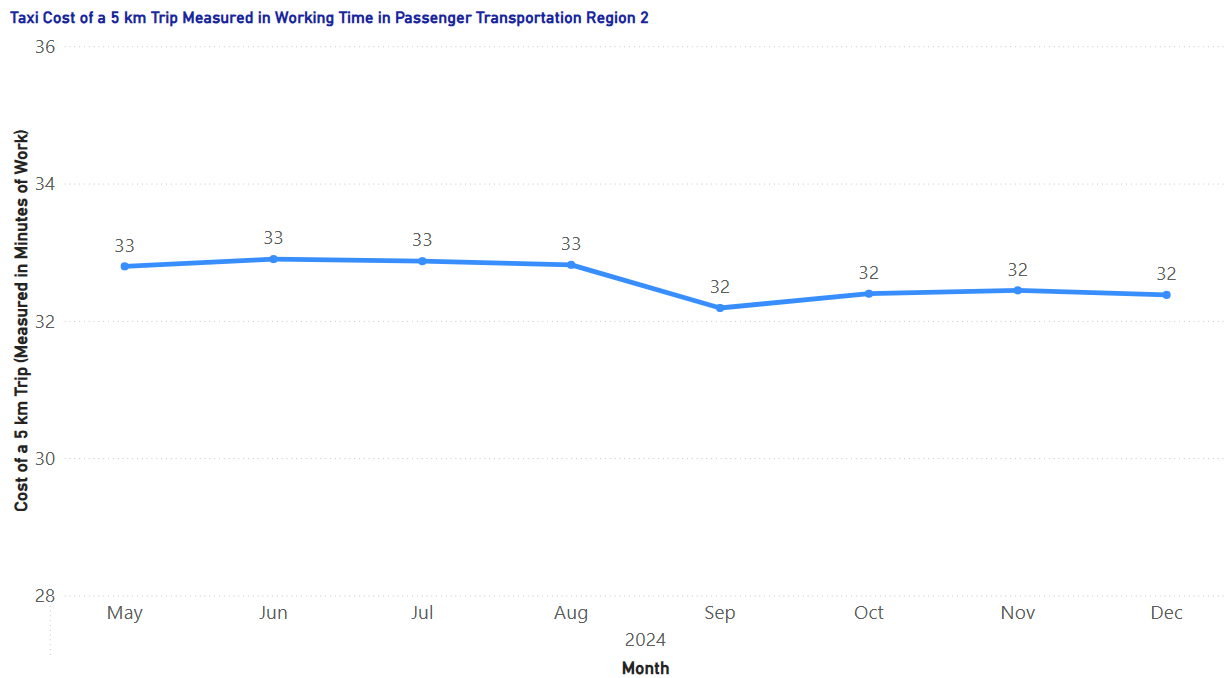
Figure 6 shows the real cost for a 5 km taxi trip measured in labour earnings of a typical B.C. worker. This metric is calculated by looking at the median hourly wage in B.C., based on Statistics Canada, and determining how many minutes this typical B.C. worker would need to work to pay for the median 5 km taxi fare. Since May 2024, this amounted to between 32-33 minutes of work.
This metric remained stable since May 2024, indicating the affordability factor, as measured by fare cost relative to passenger income, has remained consistent. In December 2024, a passenger who earned the B.C. median wage could pay for the taxi trip using earnings from 32 minutes of work, which was a 1 minute, or 3%, decrease from May 2024. This shows that the real cost for a 5 km taxi trip has been stable from May to December 2024. In other words, any increase in taxi trip fares over this period has been offset by increases in median wage.
Since the data needed to calculate this metric was unavailable before May 2024, we cannot yet draw data-supported conclusions on longer term affordability trends.
Fare cost - TNS sector
The Region 2 TNS fare cost indicator has not been provided as it does not meet the Board’s public data reporting guidelines.
[1] For example, if the real cost of a 5 km trip is 30 minutes, that means a worker who earns the median hourly wage for B.C. can pay for the trip using their labour compensation earned from 30 minutes of work.
[2]In all fare for 5 km trip visualizations, the minimum is the 10th percentile and the maximum is the 90th percentile. The data has been truncated to remove the top and bottom 10% to address data quality issues.
[3]In all fare for 5 km trip visualizations, the median represents the midpoint of the fare distribution, so that there is equal probability of the fare falling above or below this line, or half the trips would cost more, and half would cost less than the median.
[4]In Passenger Transportation Region 2, data needed for the metrics reported here are available since May 2024.