Trip revenue is an indicator used by the Board to support data-driven decision-making. This indicator is primarily related to the Demand factor, as described in the Public Need Policy.
When fare levels are unchanged, an increase in total trip revenue indicates growth in the quantity demanded in the respective markets, and a decrease in trip revenue indicates a decline in quantity demanded in those markets. Moreover, a shift in total trip revenue from the taxi sector to the TNS sector can signify a structural change in market dynamics, suggesting evolving consumer preferences or competition between the two types of partially substitutable services.
For more information on this indicator, please see the Board’s indicators webpage.
Region 1 analysis
Trip revenue indicator - Taxi sector
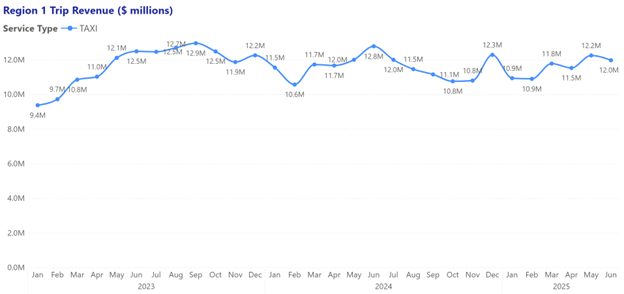
In Region 1, total taxi trip revenue in June 2025 was $12.0 million, down from $12.2 million in May (-1.64 per cent). Statistical analysis of the short-term trend suggests that there is no active shift in market direction.[1]
On a year-to-date basis, taxi trip revenue from January to June 2025 totalled $69.3 million, a 1.42 per cent decrease from $70.3 million between January and June 2024. Looking over the past two years, statistical analysis of the long-term trend suggests that trip revenue has remained stable.
Overall, trip revenue shows stable demand for taxi services in this region, with both the short-term change and the long-term trend consistent with normal variation.
Trip revenue indicator - TNS sector
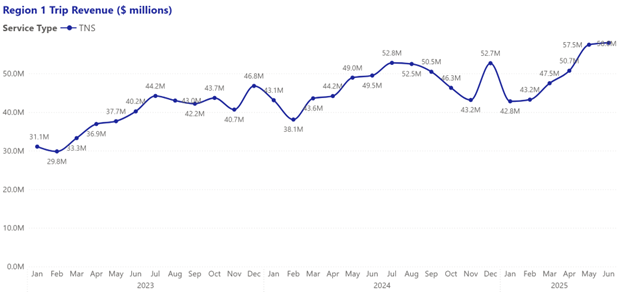
In Region 1, TNS trip revenue in June 2025 was $58.0 million, little changed from $57.5 million in May (+0.87 per cent). Statistical analysis of the short-term trend suggests that there is no active shift in market direction.
On a year-to-date basis, total TNS trip revenue from January to June 2025 was $299.7 million, representing a 12.04 per cent increase from $267.5 million between January and June 2024. Looking over the past two years, statistical analysis of the long-term trend suggests that total trip revenue is on an upward trajectory.
Overall, trip revenue points to strengthening demand for TNS services in this region, with an upward long-term trend.
Region 2 analysis
Trip revenue indicator - Taxi sector
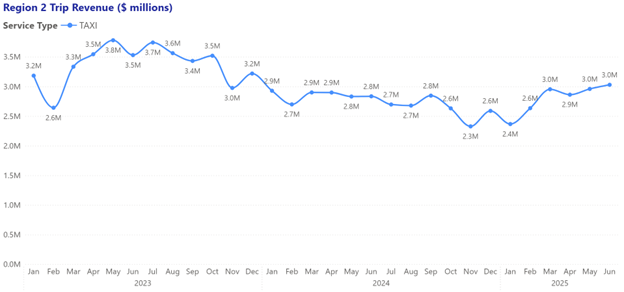
In Region 2, taxi trip revenue in June 2025 was $3.0 million, unchanged from May. Statistical analysis of the short-term trend suggests that there is no active shift in market direction.
On a year-to-date basis, total taxi trip revenue from January to June 2025 totalled $16.9 million, a 0.59 per cent decrease from $17.0 million between January and June 2024. Looking over the past two years, statistical analysis of the long-term trend suggests that total trip revenue is on a downward trajectory.
Overall, trip revenue points to softening demand for taxi services in Region 2, with a downward long-term trend.
Trip revenue indicator - TNS sector
Region 2 TNS trip revenue data is not reported as the TNS data requirements in this region have not been met.
[1] The short-term trend analysis compares short-term (3-month) and long-term (24-month) averages of trip revenue data. A shift to faster growth is detected when the short-term average grows faster than the long-term average. Similarly, a shift to slower growth is detected when the short-term average grows slower than the long-term average.