Wheelchair accessible vehicles (WAVs) is an indicator used by the Board to support data-driven decision-making. This indicator is primarily related to the accessibility factor, as described in the public need policy.
This indicator measures the number of active WAVs in a region using three approaches:
Number of Active WAVs: This metric includes three components:
a. A count of the total number of WAVs on the road.
b. A count of the number of active WAVs that reported at least one accessible trip in the month.
c. The number of WAVs approved by the Board in the region.
- Active WAVs per 100,000 Population: This metric gives context to the number of active WAVs by comparing it to population statistics over time.
- Number of Accessible WAV Trips: This metric measures the total number of trips for WAVs recorded as accessible trips in the region, including hailed and reserved trips.[1]
The wheelchair accessible vehicle indicator gives insight into the accessibility and inclusiveness of passenger transportation services for individuals who use wheelchairs or other mobility devices. Generally, a higher number of active WAVs, especially compared to overall population growth, indicates a greater level of service availability for individuals using wheelchairs or other mobility devices.
For more information on this indicator, please see the Board’s indicators webpage.
Region 1 Analysis
The following is an analysis of the WAV indicator for passenger transportation Region 1 (Lower Mainland, Whistler).
Number of active WAVs
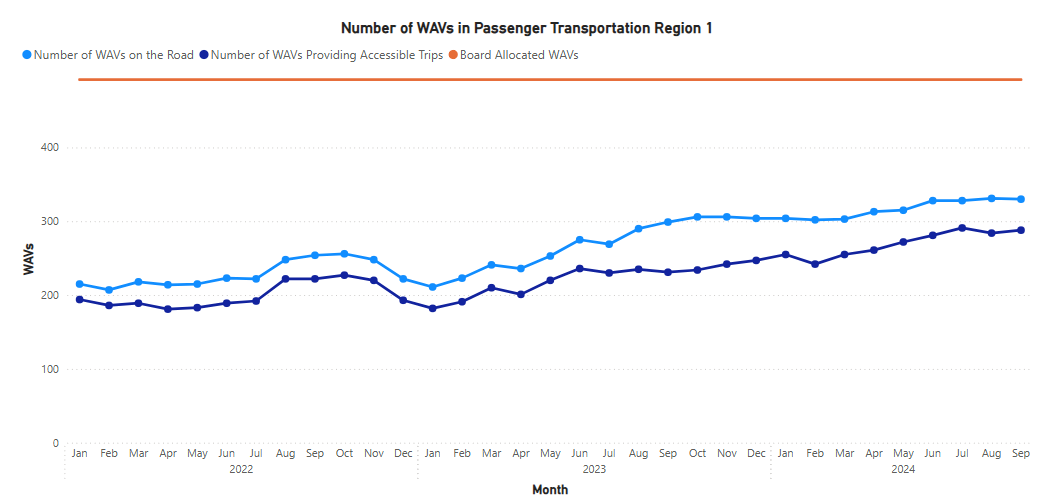
Figure 1 shows the number of active WAVs. The number of WAVs on the road in Region 1 has been steadily increasing, showing improvement in the accessibility factor. In September 2024, Region 1 had 330 registered WAVs on the road, a 10.4% increase from a year ago in September 2023.
The number of WAVs providing wheelchair accessible trips, which is smaller than the number of WAVs on the road, has also been increasing steadily in Region 1. In September 2024, Region 1 had 288 registered WAVs providing accessible trips, a 24.7% increase from a year ago in September 2023.
Active WAVs per 100,000 population
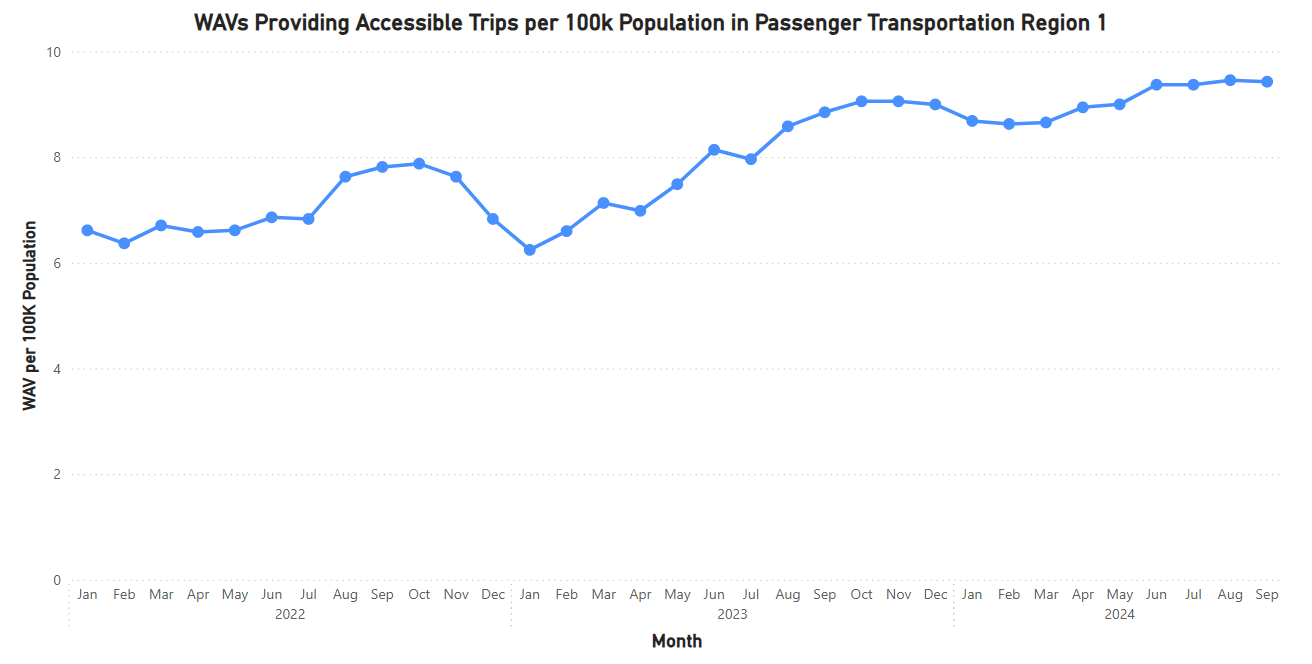
Figure 2 shows the number of active WAVs providing accessible trips per 100,000 population. This metric considers changes in WAVs in comparison to general population trends in the region. According to BC Stats, the population in Region 1 has grown 4.1% in 2024 from 2023. This means both the increase in WAVs on the road and the increase in WAVs providing wheelchair accessible trips exceed the rate of population growth in the same region.
In September 2024, there were 9.4 WAVs providing wheelchair accessible trips per 100,000 population, a 6.6% increase from a year ago in September 2023. This tells us that the accessibility factor, as measured by WAVs providing trips, is improving on a per-person basis.
Number of accessible WAV trips[2]
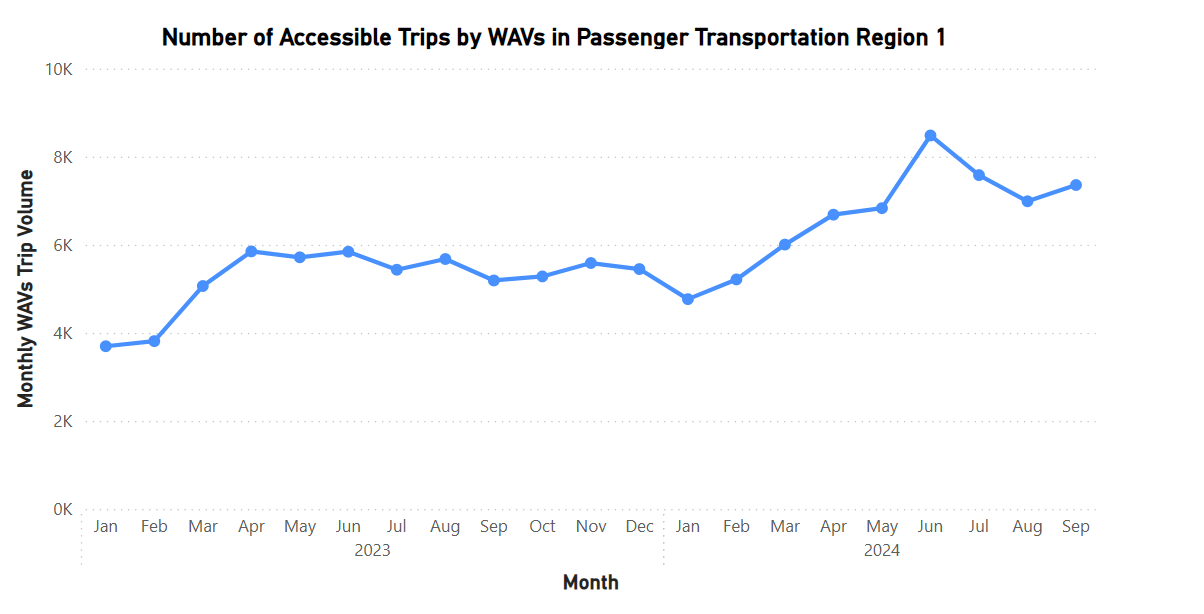
Figure 3 depicts the number of accessible trips provided by registered WAVs per month. Although there are some fluctuations, trip volume increased in 2024 compared to 2023. In September 2024, there were 7,356 accessible trips provided by WAVs in Region 1, a 41.8% increase from September 2023. Notably, this trip volume increase is greater than the increase in the number of WAVs, which means that each WAV typically provided more accessible trips in September 2024 than a year ago in September 2023, a sign of improvement in the accessibility factor for Region 1.
Region 2 analysis
The following is an analysis of the WAV indicator for passenger transportation Region 2 (CRD).
Number of active WAVs
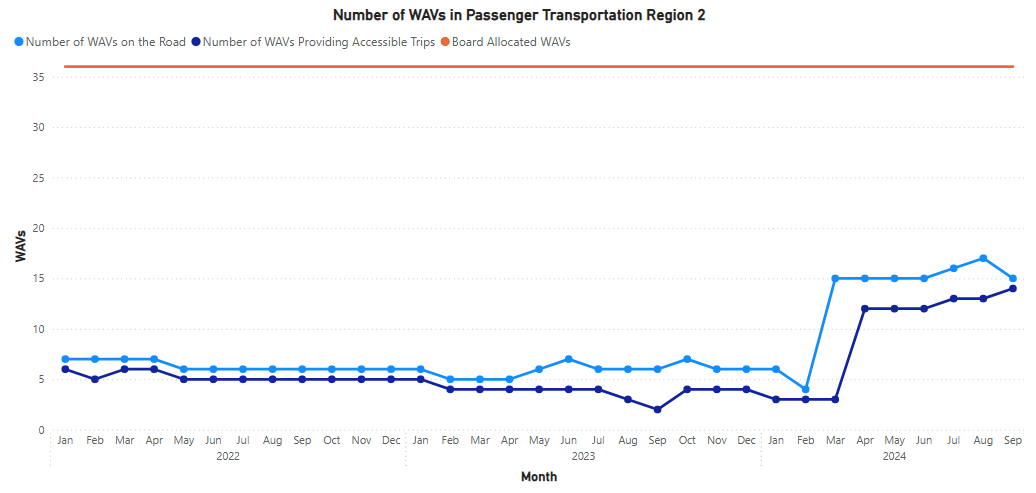
Figure 1 shows the number of active WAVs. The number of WAVs on the road in Region 2 increased in March 2024 and has remained stable since then, showing an improvement in the accessibility factor in 2024. In September 2024, Region 2 had 15 registered WAVs on the road, a 150% increase from 6 WAVs a year ago in September 2023.
The number of WAVs providing wheelchair accessible trips, which is smaller than the number of WAVs on the road, increased in April 2024 and has remained stable since then in Region 2. In September 2024, Region 2 had 14 registered WAVs providing accessible trips, a 7-fold increase from a year ago in September 2023.
Active WAVs per 100,000 population
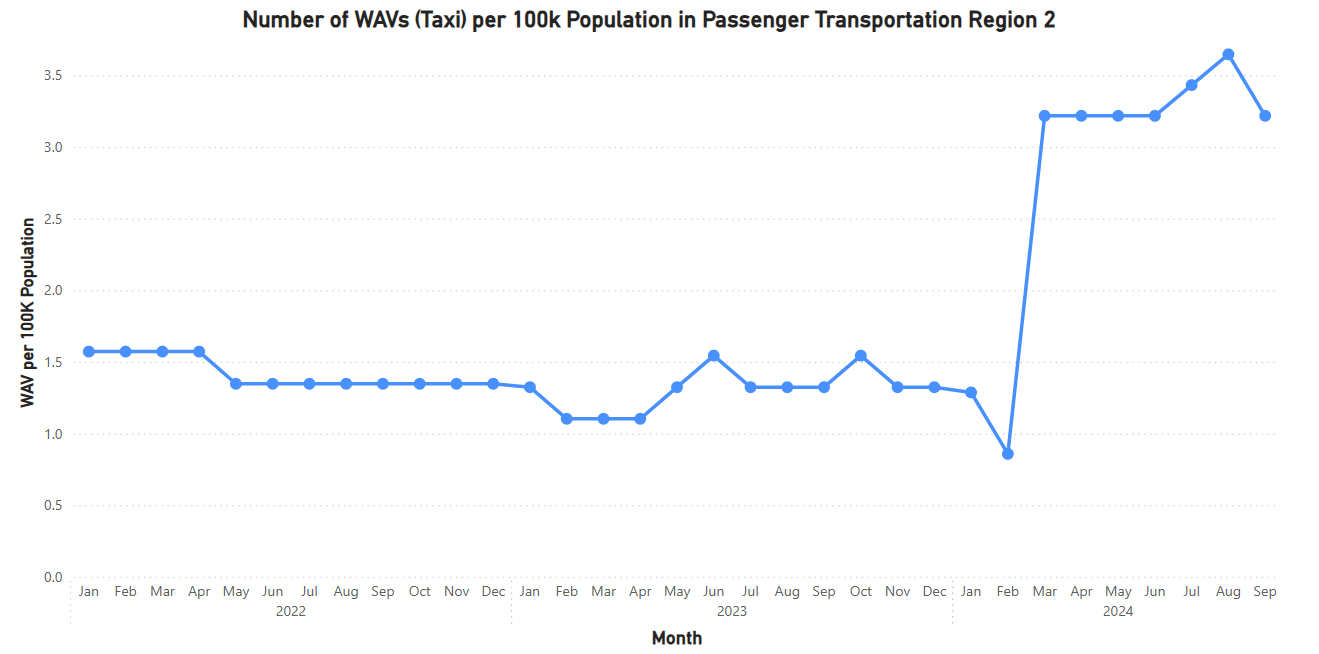
Figure 2 shows the number of active WAVs providing accessible trips per 100,000 population. This metric considers changes in WAVs in comparison to general population trends in the region. According to BC Stats, the population in Region 2 has grown 1.6% in 2024 from 2023. This means both the increase in WAVs on the road and the increase in WAVs providing wheelchair accessible trips exceed the rate of population growth in the same region.
In September 2024, there were 3.2 WAVs providing wheelchair accessible trips per 100,000 population, a 146% increase from 1.3 WAVs per 100,000 population a year ago in September 2023. This tells us that the accessibility factor, as measured by WAVs providing trips, has improved on a per-person basis.
Number of accessible WAV trips
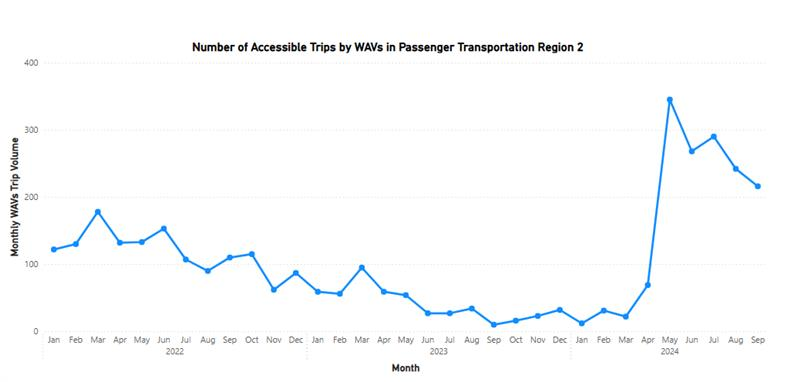
Figure 3 depicts the number of accessible trips provided by registered WAVs per month. Although there are some fluctuations, trip volume increased in 2024 compared to 2023. In September 2024, there were 216 accessible trips provided by WAVs in Region 1 -- 21.6 times the trip volume compared to 10 trips in September 2023. Notably, this trip volume increase is greater than the increase in the number of WAVs, which means that each WAV typically provided more accessible trips in September 2024 than a year ago in September 2023, a sign of improvement in the accessibility factor for Region 2.